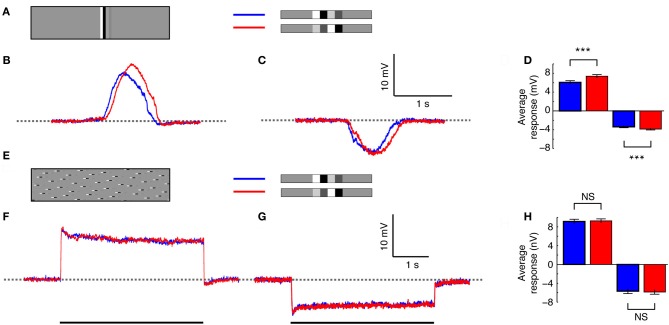
Figure 5.
Re-distribution of the stimulus. (A) The doublet pairs presented using the whole-screen mode. Blue indicates the decreasing contrast pair, and red the increasing contrast pair. (B) Intracellular HS neuron response to the doublets as they pass through the receptive field in the preferred direction (N = 8, n = 125). (C) Intracellular response to the doublets moving in the anti-preferred direction (N = 6, n = 85). (D) The mean response to the doublets moving in the preferred and anti-preferred direction. ***Indicates a significant difference (p < 0.001, Student's t-test). (E) The doublet pair broken up into individual pseudo-randomly distributed 1.8° high segments. The stimulus was displayed using the whole-screen mode. The same image was used in all recordings, but due to slight differences in receptive field alignment in respect to the CRT display, the stimulus would never have been identically perceived by two flies. (F) Intracellular HS neuron response as the stimulus moves in the preferred direction (N = 7, n = 67). (G) Intracellular HS neuron response as the stimulus moves in the anti-preferred direction (N = 5, n = 51). (H) The mean response to motion in the preferred and anti-preferred direction. NS, no significant difference.

