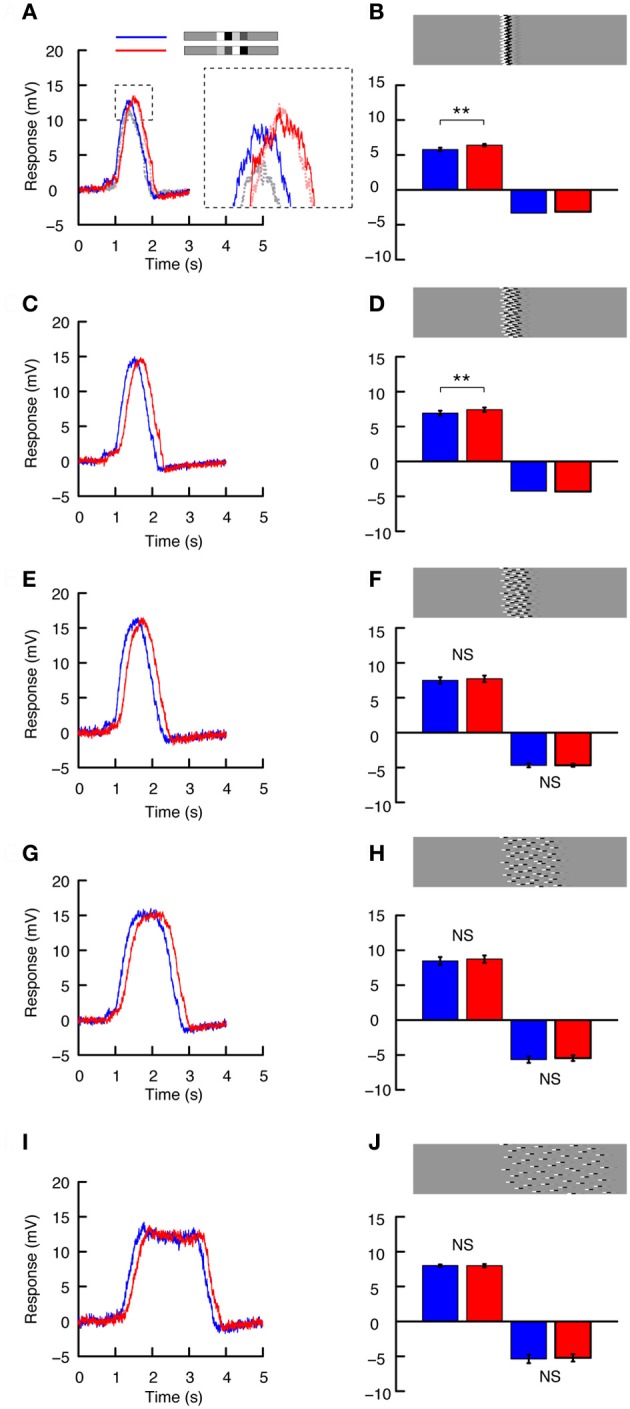
Figure 6.

The azimuthal distribution of features. (A) Intracellular HS neuron response to preferred direction motion for the image shown in part B, using the whole screen mode (blue = decreasing contrast, red = increasing contrast). The inset highlights the difference between the responses to this image (B) and that shown in Figure 5B (dashed gray = decreasing contrast, dashed light red = increasing contrast, data from Figure 5B). (B) The doublet pair is broken up into individual 1.8° high segments, which are pseudo-randomly shifted horizontally, so that the maximum horizontal offset is 11° (The absolute spread of the ensembles horizontally is thus, 11° + the doublet pair width, 11° + 30°). The bars show the mean response to motion in the preferred and anti-preferred direction. Npref= 6, n = 65. Nnull= 1, N = 5 (t-test done across repetitions in the single neuron). Stars indicate a significant difference (**p < 0.01, Student's t-test). (C) Response to preferred direction motion of the image shown in (D) Once again, the doublet pairs are broken up into individual 1.8° high segments, which are pseudo-randomly shifted such that the maximum horizontal displacement is 22°. The bars show the mean response to motion in the preferred and anti-preferred direction. Npref= 5, n = 55. Nnull = 1, N = 5 (t-test done across repetitions in the single neuron). Stars indicate a significant difference (**p < 0.01, Student's t-test). (E) As above but for the image shown in (F) The doublet pairs are now distributed over 45°. (F) The bars show the mean response to motion in the preferred and anti-preferred direction. Npref= 5, n = 55. Nnull = 1, N = 5 (t-test done across repetitions in the single neuron, errorbar calculated across n). NS, no significant difference, Student's t-test. (G) As above but for the image shown in H. (H). The doublet pairs are now distributed over 90°. The bars show the net mean response to motion in the preferred and anti-preferred direction. Npref = 5, n = 42. Nnull = 2, n = 13 (t-test done across repetitions independently in the two neurons, errorbar calculated across n). NS, no significant difference, Student's t-test. (I). As above but for the image shown in J. (J) The doublet pairs are now distributed over 180°. The bars show the mean response to motion in the preferred and anti-preferred direction. Npref = 3, n = 27 (t-tests done across repetitions independently in the three neurons, errorbar calculated across n). Nnull = 2, n = 15 (t-tests done across repetitions independently in the two neurons, errorbar calculated across n). NS, no significant difference, Student's t-test.
