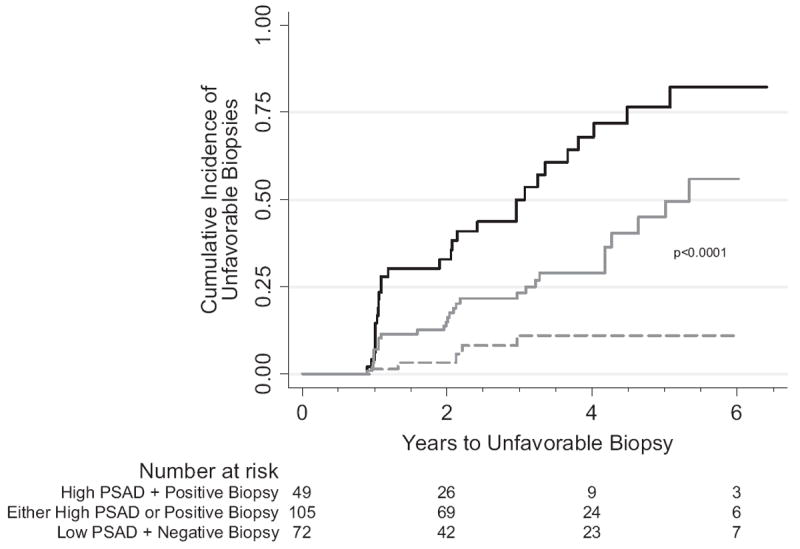
Figure 2.

Unfavorable biopsy unadjusted Kaplan-Meier cumulative event curves in patients at low—low PSAD (less than 0.08 ng/ml/cm3) plus negative biopsy (dashed curve), intermediate—high PSAD or positive biopsy (solid gray curve) and high—high PSAD (0.08 ng/ml/cm3 or greater) plus positive biopsy (solid black curve) risk based on biopsy results and PSAD at initial surveillance visit (high vs intermediate vs low risk log rank test p <0.0001).
