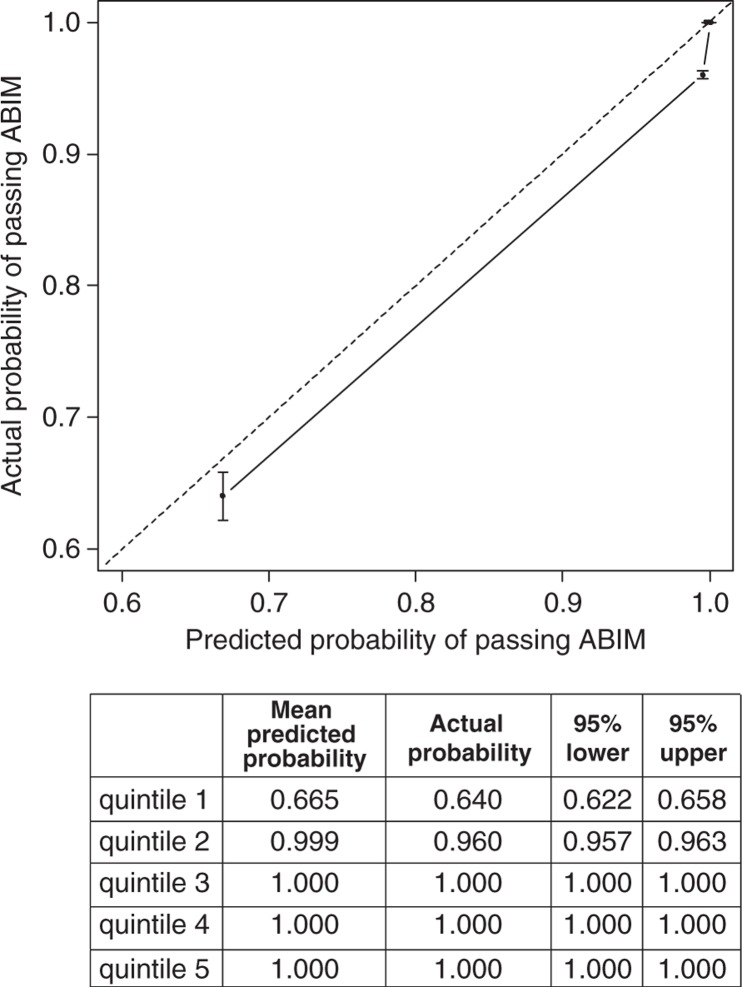
Fig. 3.
Calibration plot for predicted and observed passing ABIM examination. Residents in the validation cohort were divided in five quintiles based on the predicted probability. The 45-degree straight line represents ideal agreement between actual and predicted probability. The vertical bars represent the 95% CI of the actual probability. Note that the points for the three highest quintiles were overlapping together in the plot because of ignorable differences.

