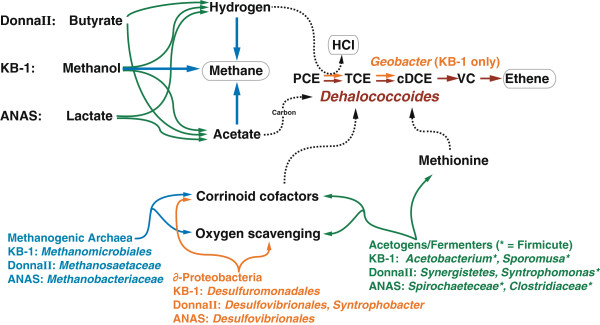
Figure 2.
Schematic overview of the examined metabolic processes taking place within the dechlorinating enrichment consortia, with the organisms implicated in each process highlighted. End products are boxed in light grey. Organisms are coloured by taxonomic affiliation and process: Methanogenesis and synthesis pathways encoded by methanogenic Archaea are in blue, acetogenesis and other processes largely attributed to Firmicutes are in green, and pathways encoded by ∂-Proteobacteria are in orange. NB: A hydrogen molecule is required for each dechlorination step from PCE to ethene: only the first dechlorination reaction is depicted here.

