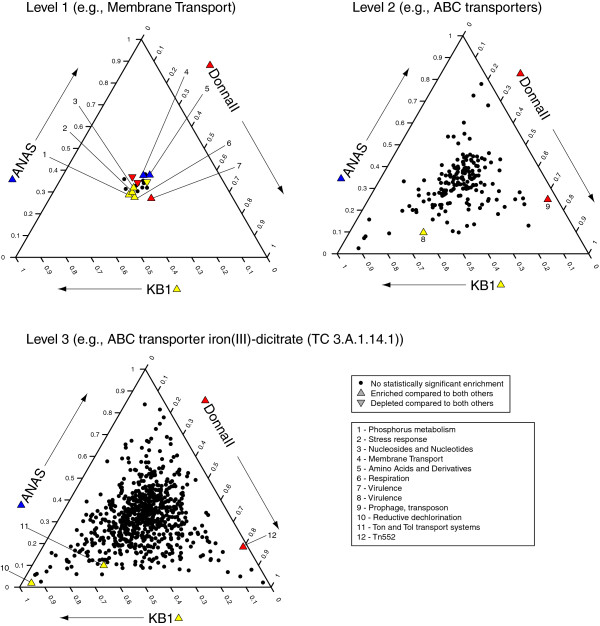
Figure 4.
Three-way comparisons of metabolic differences within the enrichment culture metagenomes with all Dhc reads removed. Points are displayed as in Figure 3, with points here corresponding to MG-RAST assignments to categories of metabolic classification within The SEED database. The closer to a corner of the plot a point falls, the more highly proportionally enriched that category is within the metagenome affiliated with that corner (arrows). Points located in the center of the plot are not enriched in one metagenome compared to the others. Coloration and shapes are as in Figure 3. Labeled points correspond to all categories for which one metagenome was significantly enriched above the other two. For the metabolic level 1 class, the threshold for plotting was increased to 1% to reflect the lower number of possible categories.

