
Figure 1.
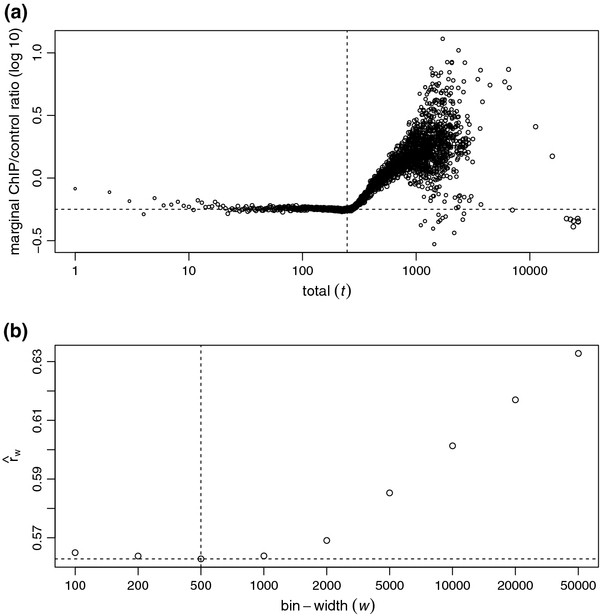
ChIP/control ratio as a function of total count for C.elegans data. (a) Marginal ChIP/control ratio against total count, both in log (10) scale, from a C.elegans ChIP-seq dataset of transcription factor PHA-4 [18]. Sizes of the plotting circles are proportional to log (10) of numbers of reads. Vertical dash line marks the total count selected by NCIS to estimate the normalization constant. Horizontal dash line marks the normalization factor estimate from NCIS. (b) Normalization constant as a function of bin-width. Vertical dash line marks the bin-width selected by NCIS to estimate the normalization constant. Horizontal dash line marks the normalization factor estimate from NCIS.