
Figure 3.
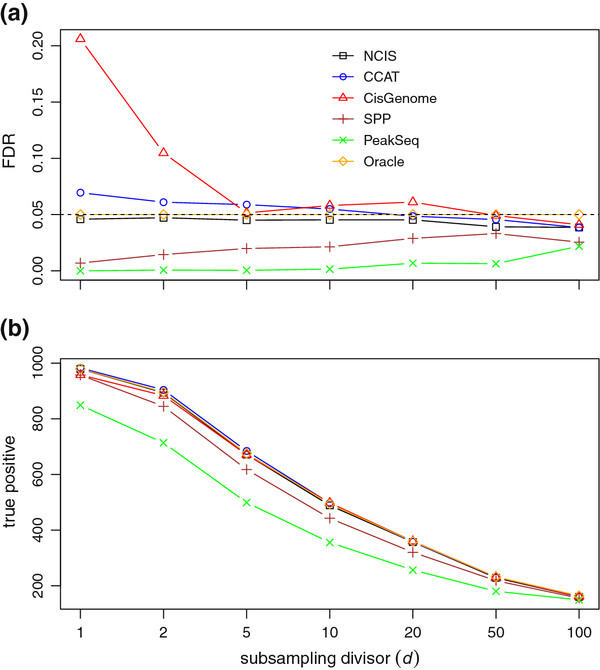
FDR control and power. FDR control with the sample-swapping method. (a) compares FDR levels with different normalization factor estimators. (b) Power comparison between between FDR control at 0.05 level with different normalization factor estimators.