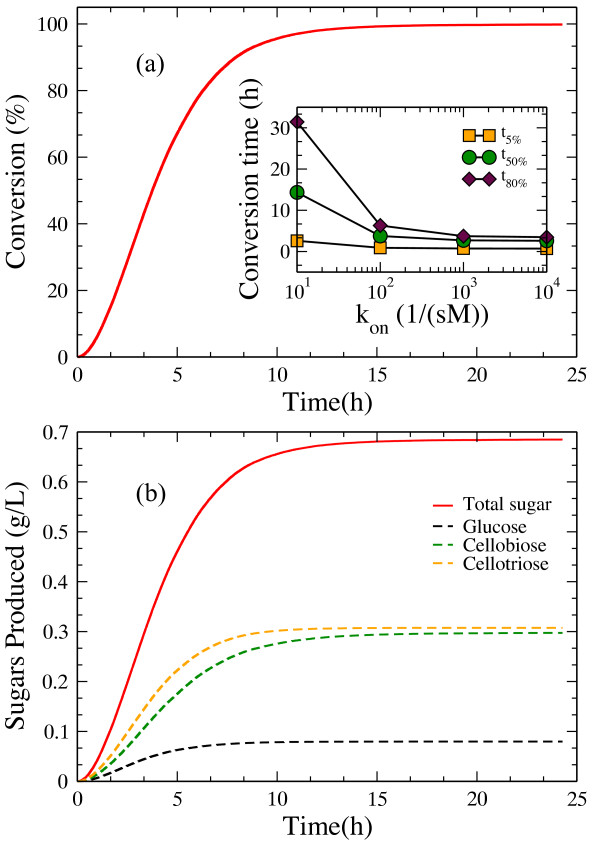
Figure 7.
(a) Hydrolysis by endo-cellulases. Time course of hydrolysis by endo-cellulases.The inset shows the variation in the conversion time needed to degrade 5%, 50% and 80% of the substrate as a function of the adsorption rate constant kon. (b) Total sugar production and individual monomer and oligomer component distribution over time.

