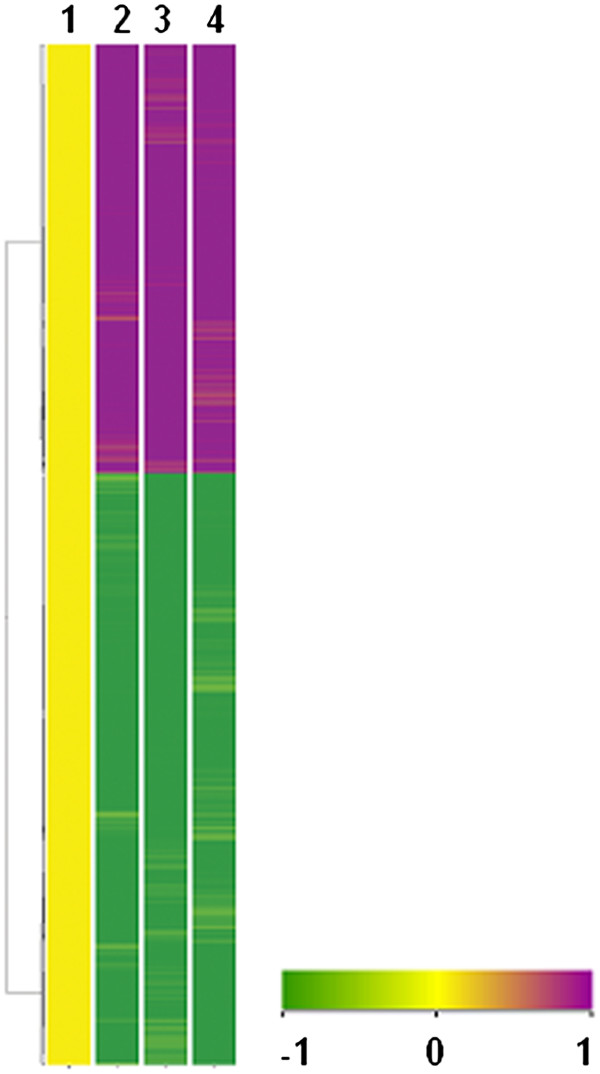
Figure 3.

Pulmonary gene expression signature of guinea pigs at 10 weeks post M. tuberculosis infection. Transcriptional profile of lungs of guinea pig was analysed by microarray. The figure depicts the clustered heat maps obtained thereof for the genes expressed in a differential manner between the experimental and control groups. By using unsupervised hierarchical clustering algorithm, the most similar expression profiles are joined together to form a group. These are further joined in a tree structure, until all data forms a single group. Clustering is based on Average- distance between two clusters, which is the average of the pair-wise distance between entities in the two clusters. For the measurement of similarity between conditions, Pearson coefficient correlation clustering algorithm is used. The color scheme for the hierarchical clustering is yellow: no change in expression, magenta: higher expression in infected lungs relative to normal lungs and green: lower expression in infected samples relative to normal uninfected lungs. 1: Uninfected lung; 2: Infected Lung 1; 3: Infected Lung 2; 4: Infected Lung 3.
