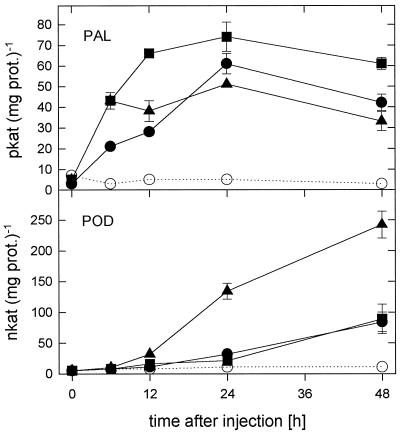
Figure 5.
Time-response curves of PAL and POD elicitation by polymeric chitosans with DAs of 1% (circles), 35% (squares), and 60% (triangles) at 100 μg mL−1 upon injection into the intercellular spaces of primary wheat leaves. Data are means ± sd of triplicate samples from one representative of two independent experiments. The dotted lines indicate enzyme activities of water-treated control plants. prot., Protein.

