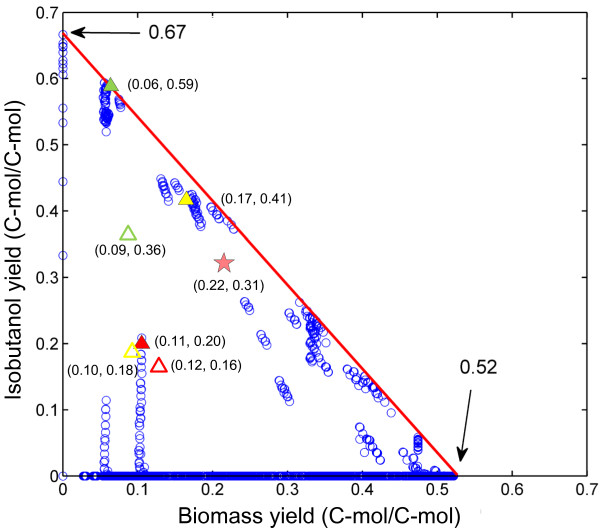
Figure 1 .
EMs for isobutanol and biomass biosynthesis in isobutanol-producing B. subtilis BSUL03. The solution of the EMs is represented by the blue circles. All possible solutions locate the interior as well as the sides of the rectangular triangle. EMs on the axes represent extreme modes exclusively linked to the formation of either isobutanol or biomass. The solid triangles indicate the best modes of the simulated mutants at optimal performance. The hollow triangles indicate the experimental values of different mutants in batch fermentations. Red, BSUL03; yellow, BSUΔldh or BSUL04; green, BSUΔldhΔpdhC or BSUL05. The pink pentagram indicates the experimental values of BSUL05 in fed-batch fermentations.

