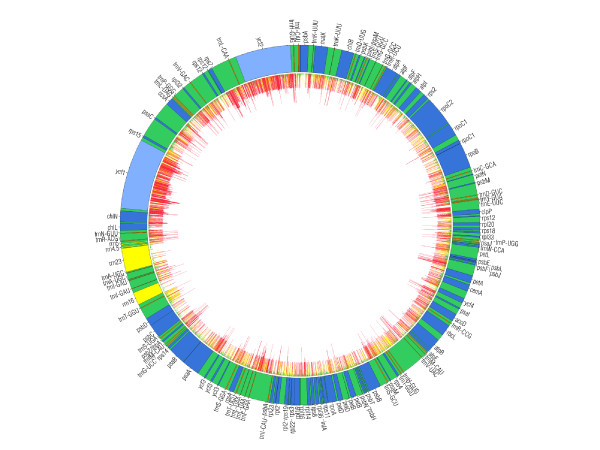
Figure 2.
Distribution of OV for variable plastome alignment positions. Schematic of the Pinus chloroplast genome with annotated protein-coding exons (blue), rRNA loci (yellow), tRNA loci (orange) and noncoding regions (green). The coding loci ycf1 and ycf2 are highlighted in light blue. The distribution of OV values > 0 is indicated by the internal histogram, as follows: red – most variable 4.6 kbp (A142165 to A136665 ); yellow – most variable sites from 4.6 to 8.3 kbp (A136565 to A133065 ); green – remaining sites with OV > 0.

