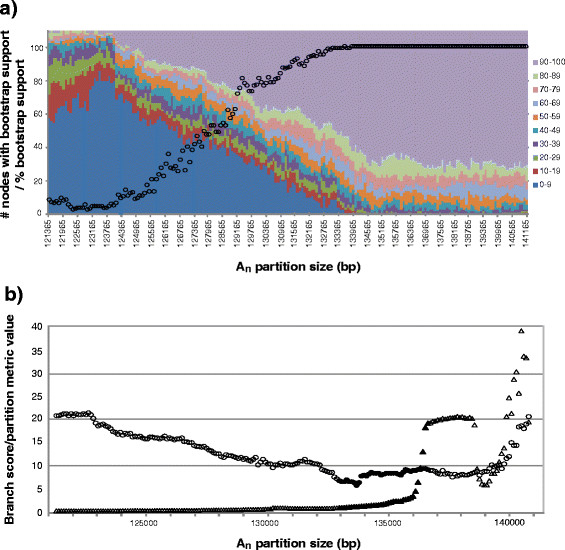
Figure 3.
Trends in bootstrap support values and topologies for likelihood analyses of alignment partitions. For OV-based analyses, the following are shown: a) Distributions of bootstrap support values for all nodes. Circles represent median bootstrap support for each An partition size. b) Distribution of branch score metric (triangles) and partition metric (circles) values for tests of topological congruence between An and corresponding Bn data partitions. Filled data points correspond to An partitions sizes falling between final decrease of branch score metric values and start of decreases in overall bootstrap support values for An partitions. Partition metric values shown are 0.1× actual value in order to fit on same scale with branch score metric values.

