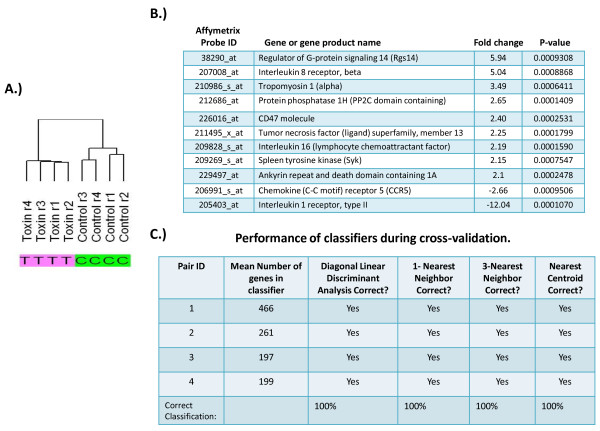
Figure 2.
Unsupervised microarray analysis. A.) Hierarchical clustering dendrogram showing similarities between expression patterns within each condition. Specimens were paired based on donor, using 4 separate donors as indicated in replica r1 through r4. B.) Significant genes (p < 0.001) up or down regulated after LT treatment, along with their fold change, p-value and probe ID. C.) Leave-one-out-cross validation was used to calculate mis-classification rate that yielded a 100% correct classification between pairs.

