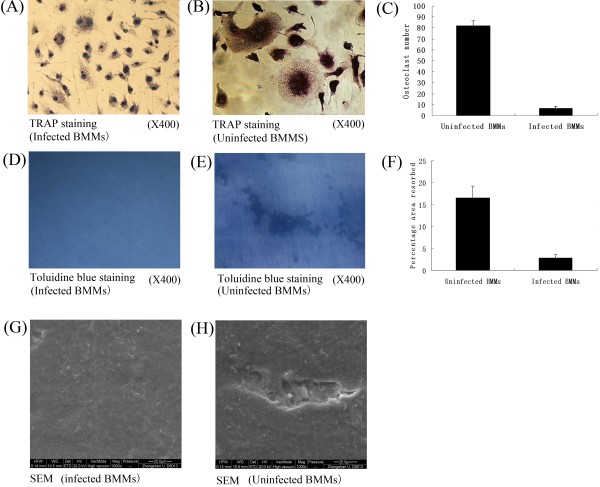
Figure 5.
Inhibition of osteoclastogenesis by RANK silencing. (A, B) Osteoclast differentiation of BMMs as identified by TRAP staining. (C) Quantification of the data. The multinucleated TRAP-positive cells (>3 nuclei) in eight random view areas (at 200× magnification) in each of the five replicates were counted. Osteoclast resorption was quantified using toluidine blue staining (at 400× magnification) (D,E,F). Comparison of the resorption area of bone slices between untreated and treated BMM cells was evaluated by Scanning Electron Microscopy (at 400× magnification) (G, H).

