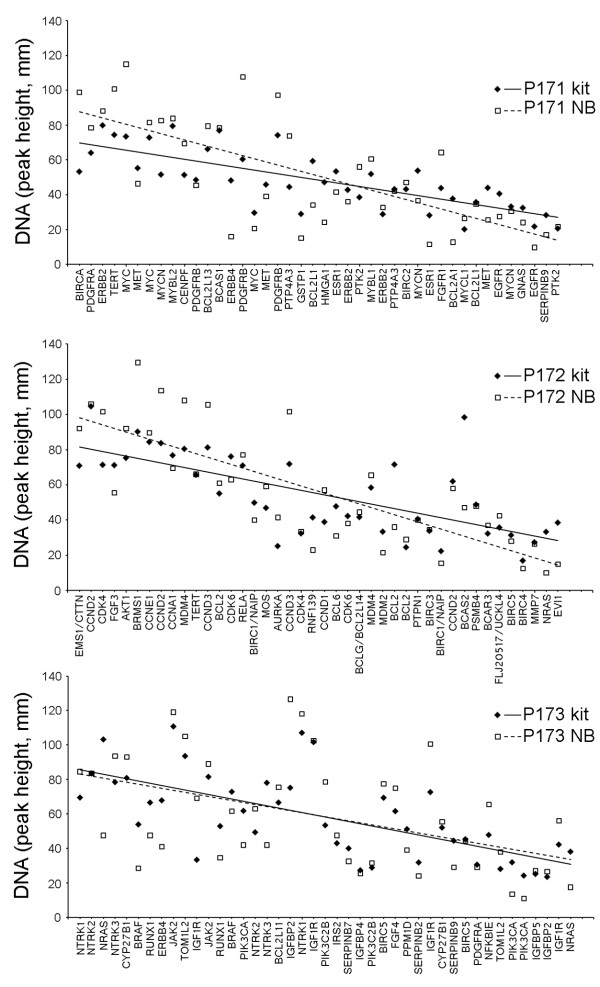
Figure 1.
Scatterplots of DNA values for genes in non-neoplastic brain versus normal values provided in MLPA kits. The amounts of DNA represent copy number (CN) for each gene assayed. The non-neoplastic (or normal) brain DNA (NB) was evaluated by comparing its values with expected values provided by the manufacturer. Regression analysis of NB values, that were obtained when FFPE-GBM1 was tested with the P171 kit, identified ERBB4 at the lower limit of the 95 % confidence interval as an outlier. The overlays of observed NB values with normal values included in the P171, P172, and P173 kits demonstrated overall correspondence for both sources of non-neoplastic DNA in the data distributions. Their trendlines are also shown.

