
Figure 2.
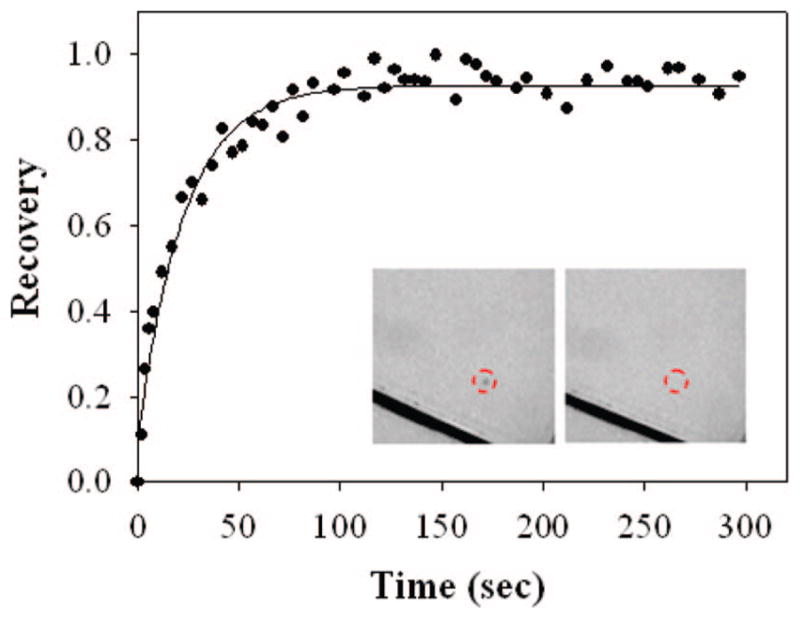
FRARP curve from a BSA-supported POPC bilayer with 0.1 mol % Texas Red DHPE. The BSA was introduced at 0.1 mg/mL. The black lines in the inset fluorescence images are scratches that were intentionally made with a pair of metal tweezers for the estimation of the background contribution to the measured fluorescence intensity. The dashed red circles highlight the position of the beach spot. The inset images, which are 230 μm × 230 μm, were captured immediately after photobleaching and again 300 s later.