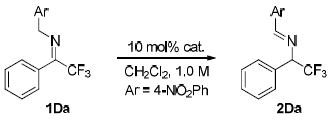
Table 2.
Reaction optimizationa

| |||||
|---|---|---|---|---|---|
| Entry | cat. | T(°C) | t(h) | conv. (%)b | ee (%)b |
| 1 | DHQ-3 | rt | 0.5 | 47 | 5 |
| 2 | DHQ-3 | rt | 0.5 | 16 | 0 |
| 3 | Q-5 | rt | 0.5 | 38 | 8 |
| 4 | Q-6 | rt | 0.5 | < 5 | - |
| 5 | DHQ-7a | rt | 0.5 | 97 | 26 |
| 6 | DHQ-7b | rt | 0.5 | 80 | 17 |
| 7 | DHQ-7c | rt | 0.5 | 71 | 31 |
| 8 | DHQ-7d | rt | 0.5 | 62 | 38 |
| 9 | DHQ-7e | rt | 0.5 | 90 | 58 |
| c10 | DHQ-7f | rt | 0.5 | 95 | 68 |
| 11 | DHQ-7g | rt | 0.5 | 98 | 28 |
| 12 | DHQ-7f | -20 | 12 | 87 | 78 |
| d13 | DHQ-7f | -20 | 72 | 80 | 82 |
| e14 | DHQ-7f | -20 | 24 | 71 | 88 |
| f15 | DHQ-7f | -20 | 24 | 84 | 88 |
| f16 | DHQ-7f | -30 | 48 | 81 | 90 |
Unless specified, the reaction was carried out with 1Da (0.05 mmol) in CH2Cl2 (0.05 mL) in the presence of catalyst (0.005 mmol).
Determined by HPLC analysis.
After 48h, the ee value was reduced to 46%.
The reaction was performed in CH2Cl2 (0.50 mL).
The reaction was performed in PhMe (0.50 mL).
The reaction was performed with 1Da (0.05 mmol) and 4 Ǻ MS (5.0 mg) in PhMe (0.50 mL) in the presence of DHQ-7f (0.005 mmol).
