
Figure 8.
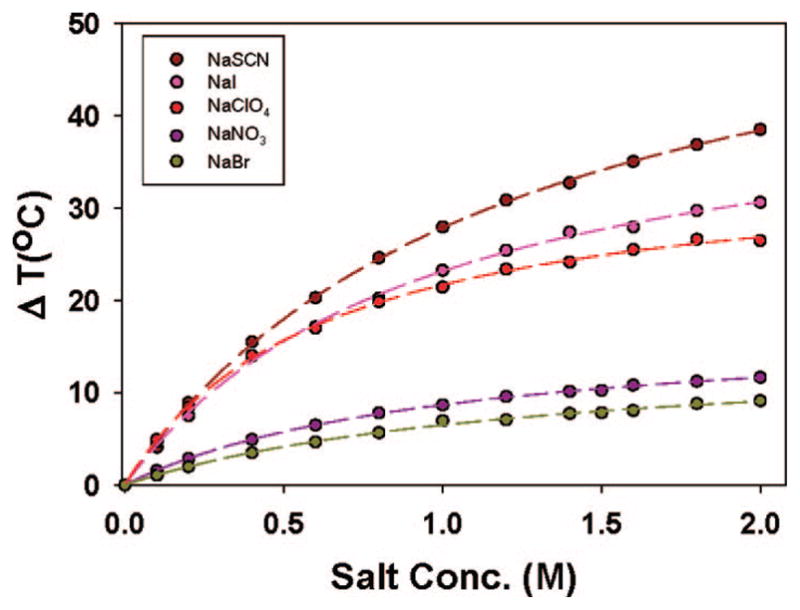
Residual LCST vs salt concentration data for the chaotropic anions with ELP V5A2G3-120 after subtracting out the linear portion of the data. The dashed lines represent Langmuir isotherm fits to the data points.
Official websites use .gov
A
.gov website belongs to an official
government organization in the United States.
Secure .gov websites use HTTPS
A lock (
) or https:// means you've safely
connected to the .gov website. Share sensitive
information only on official, secure websites.
Residual LCST vs salt concentration data for the chaotropic anions with ELP V5A2G3-120 after subtracting out the linear portion of the data. The dashed lines represent Langmuir isotherm fits to the data points.