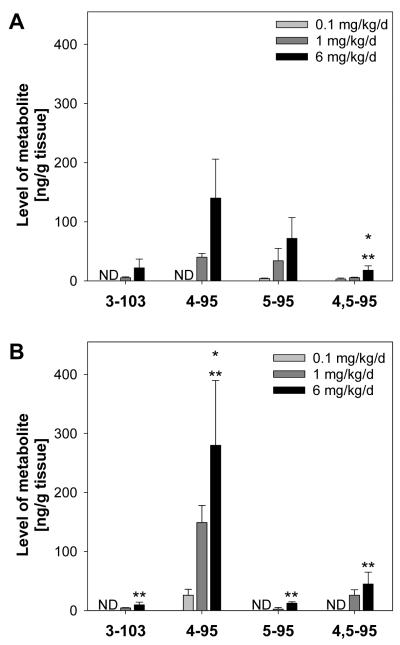
Fig. 3.
Levels of OH-PCB metabolites in (A) liver and (B) blood of female C57Bl/6 mice orally exposed to PCB 95 over 39 days. The levels in the low dose-treatment group were not different from the control animals (see Table S4), and levels in the higher dose treatment groups were dose dependent. Data are presented as the mean ± SD. * Significantly higher than low dose treatment group, p<0.05; ** significantly higher than medium dose treatment group, p<0.05.

