Fig. 2.

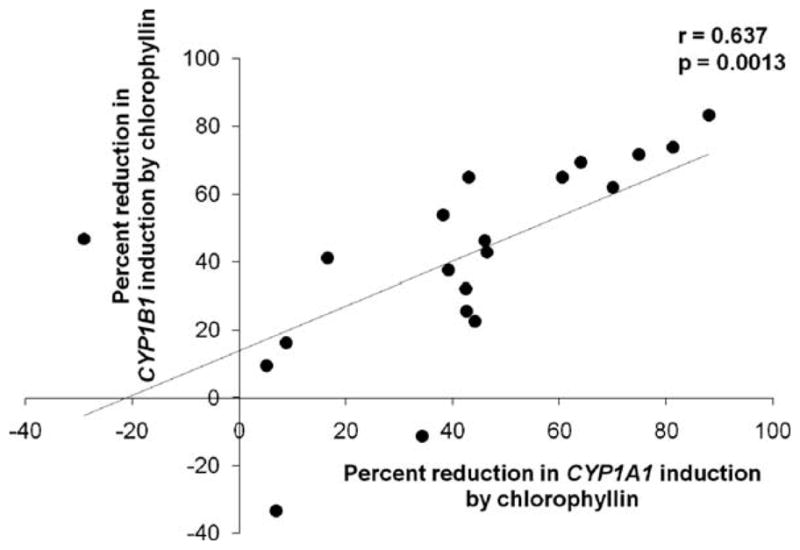
Strain-wise correlation for the percent reduction in expression of CYP1A1 and CYP1B1 in T4 cells compared to T1 cells (r = 0.637, p = 0.0013); the graph shows data for all 20 NHMEC strains.

Strain-wise correlation for the percent reduction in expression of CYP1A1 and CYP1B1 in T4 cells compared to T1 cells (r = 0.637, p = 0.0013); the graph shows data for all 20 NHMEC strains.