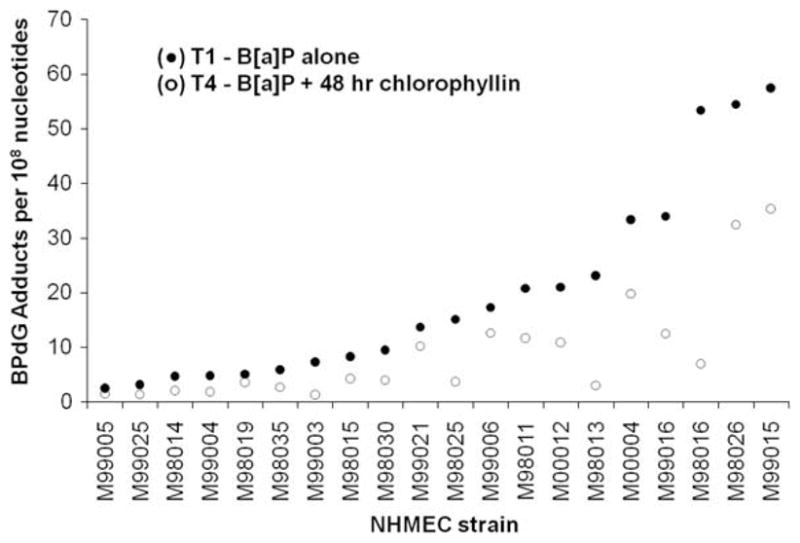
Fig. 3.

Pairwise BPdG adduct values (per 108 nucleotides) for 20 NHMEC strains exposed to either BP alone (T1 group, ●) and or BP plus chlorophyllin (T4 group, ○). Adduct values for each strain are ranked in order of extent of BPdG formation in the T1 group.
