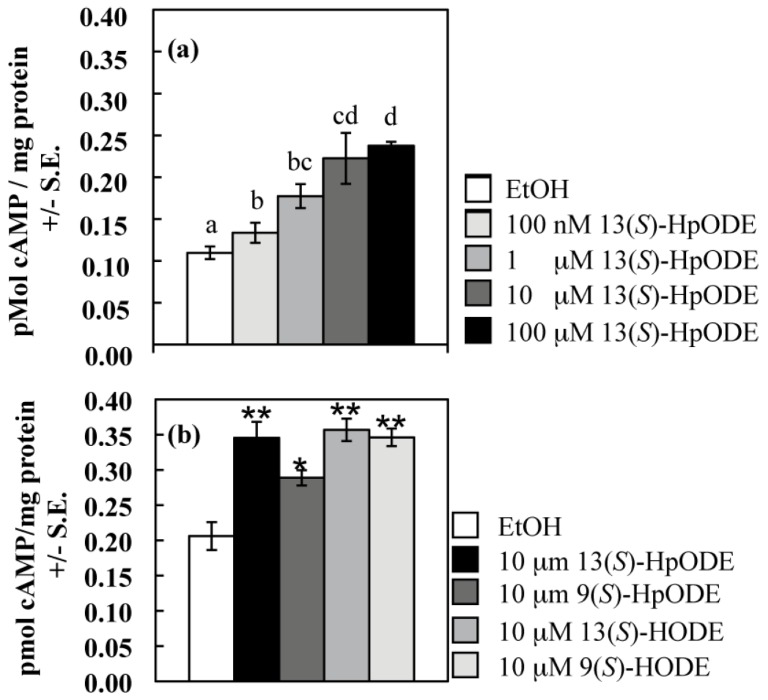
Figure 1.
(a) Samples were treated with EtOH (control) or an equivalent volume of 13(S)-HpODE dissolved in EtOH to achieve the final sample concentrations listed; (b) Samples were treated with EtOH (control) or an equivalent volume of pure oxylipin dissolved in EtOH to achieve a final sample concentration of 10 μM. For both (a) and (b), tissues were harvested as described, and cAMP concentrations were measured. Differing letters above bars in (a) denote treatments significantly different from one another (p≤ 0.05; one-tailed paired Student’s T-test). Differences from the EtOH control in (b) are denoted as follows: *p < 0.05; **p < 0.01, determined by one-tailed paired Student’s T-tests.

