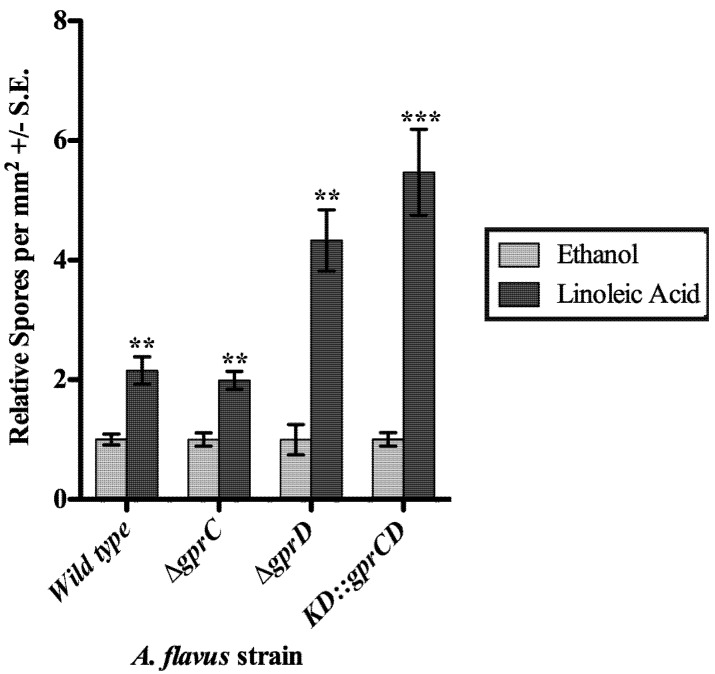
Figure 5.
Spores were counted from the area of a plate surrounding a disk soaked with ethanol or linoleic acid in ethanol. The counts from the ethanol control disks were set to one, and the spore totals from the same strain exposed to linoleic acid (dark gray bars) were expressed relative to the ethanol control spore counts (light gray bars). Differences between the two treatments for each strain are denoted as follows: *p < 0.05; **p < 0.01; ***p < 0.001, determined by two-tailed unpaired Student’s T-tests.

