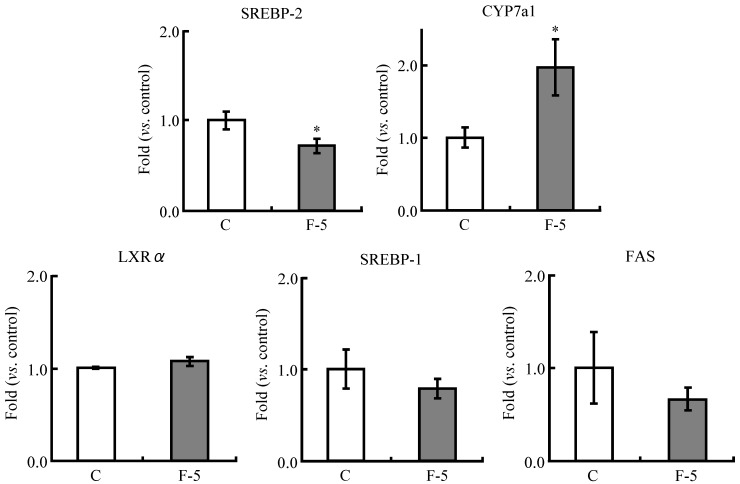
Figure 4.
Expression of lipid metabolism-related genes in the liver of rats fed experimental diets for 5 weeks. The expression of mRNA was quantitatively measured by real-time RT-PCR. Each value is the mean ± SE for 8 rats. The data were normalized to GAPDH RNA expression and are presented as a ratio to the C value. Statistically significant compared with the control group (* p < 0.05; Student’s t-test).

