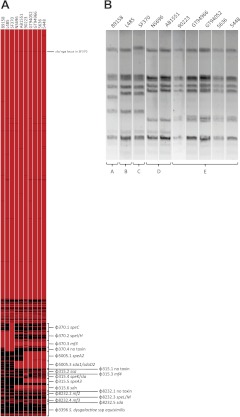
Figure 1.
Preliminary genotyping of S. pyogenes serotype M1 isolates. A) DNA-DNA microarray heat map of M1 isolates generated using an oligonucleotide glass slide array described previously and comprised probes representing the M1 core ORFeome (24). Additional probes representing prophage ORFs from GAS serotypes M1, M3, M18, and S. dysgalactiae subsp. equisimilis were included on the array and have been labeled on the heat map. Heat map was generated from background-subtracted median-normalized fluorescence units. Values equal to or exceeding threshold were designated present (red), while those below were considered absent (black). B) PFGE of M1 isolates digested with SmaI. Strains under examination are given at the top of the gel, and isolates are grouped into PFGE types A–E.

