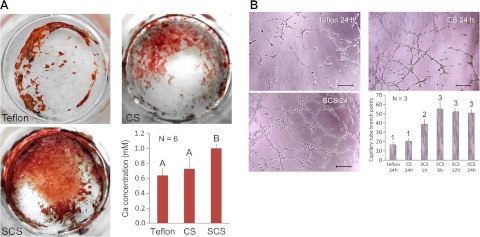
Figure 5.
A) Alizarin red S staining of extracellular bone nodules produced by differentiated MDCs after they were exposed to the Teflon control (top left panel), CSs (top right panel), and SCSs (bottom left panel) for 72 h. Bar chart (bottom right panel) summarizes the results of in vitro osteogenesis. Groups designated by the same uppercase letters are not statistically significant (P>0.05). B) Tube formation by EPCs represents a simple model of angiogenesis in which induction or inhibition of tube formation by exogenous signals may be monitored. Representative light microscopy images show EPCs after they were exposed to extracts derived from the Teflon control for 24 h (top left panel), CSs for 24 h (top right panel), and SCSs (bottom left panel) for 24 h. Scale bars = 100 μm. Bar chart (bottom right panel) summarizes the results of in vitro proangiogenesis. Extracts from SCSs were examined after the immersion of these scaffolds in phosphate-buffered saline (pH 7.4) for different time periods (1, 6, 12, and 24 h). Groups designated by the same numeric descriptors are not statistically significant (P>0.05).

