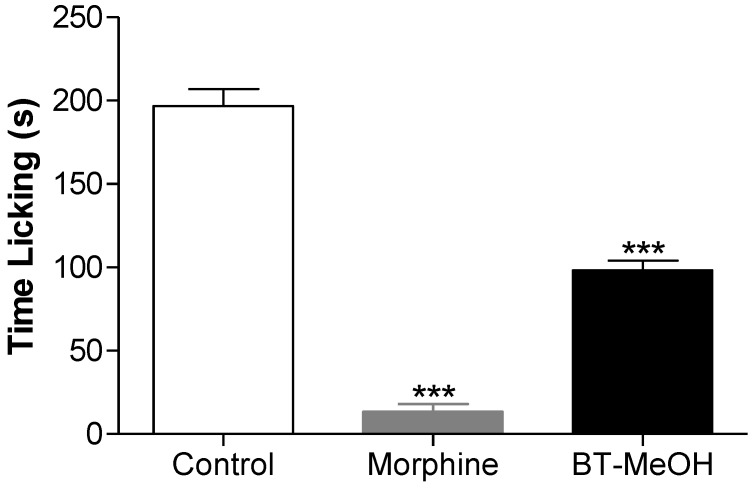
Figure 4.
Antinociceptive effect of the BT-MeOH (100 mg/kg, p.o.) and morphine (5.7 mg/kg, s.c.) in glutamate-induced nociception test. Each column represents the mean ± S.E.M. of six animals. Statistical differences between the treated and control groups were evaluated by ANOVA and Dunnett’s test, and the asterisks denote the level of significance in comparison with control group, *** p < 0.001.

