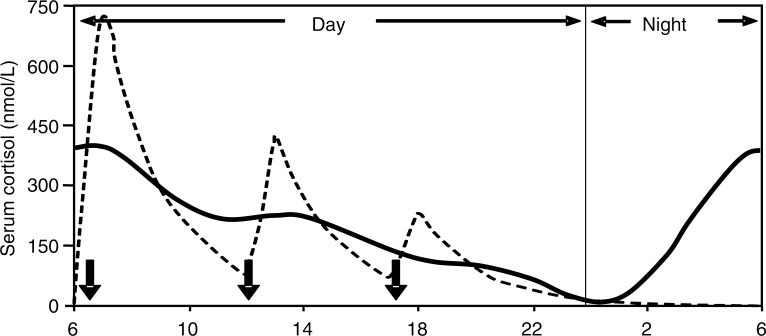
Figure 2.
Simulated cortisol profile for a patient (broken line) following thrice-daily hydrocortisone administration (10 mg at 06:00, 5 mg at 12:00 and 2.5 mg at 18:00, shown as solid arrows). (Reproduced with permission from John Wiley & Sons Ltd. and Mah et al. [2004]).

