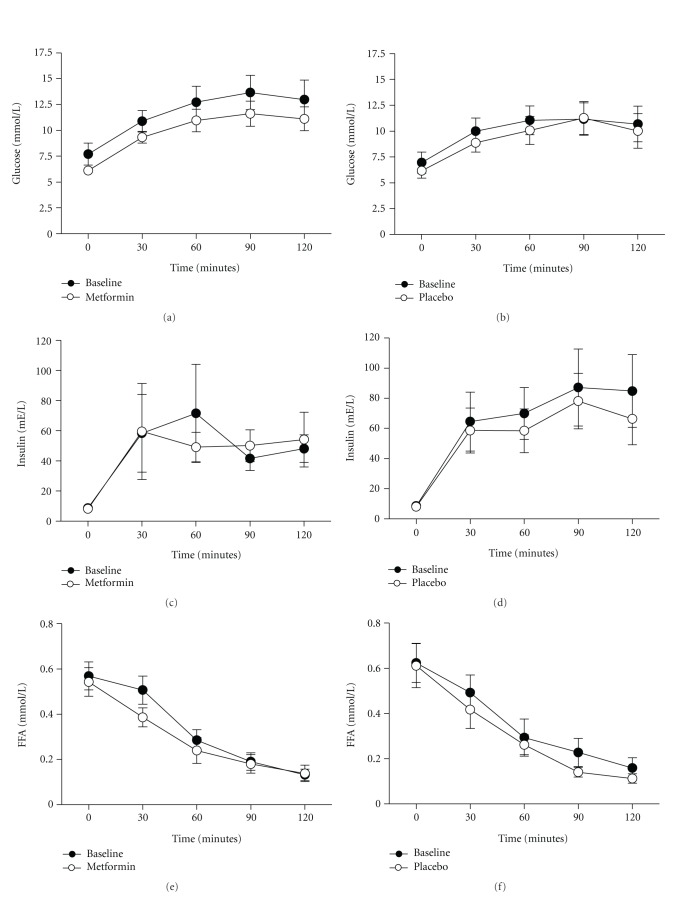
Figure 2.
Mean change in glucose, insulin, and free fatty acid (FFA) concentrations during an oral glucose tolerance test (OGTT) in insulin resistant patients at baseline and six weeks after treatment with either metformin (N = 10) (a, c, and e) or placebo (N = 9) (b, d, and f). Data represent the mean ± SEM.

