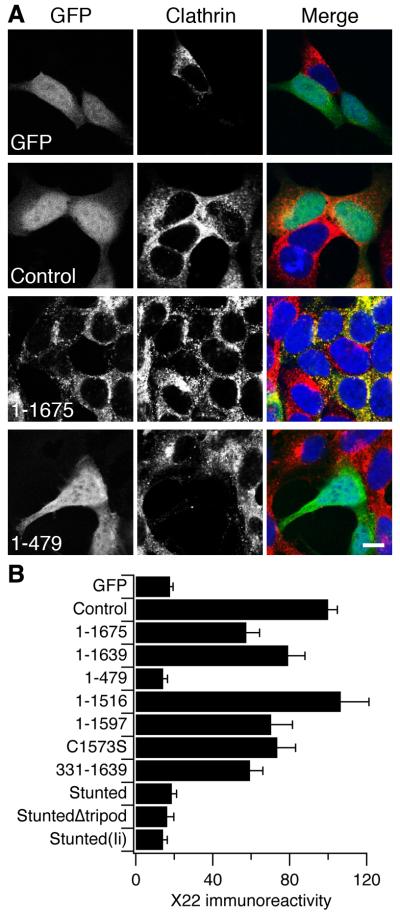
Figure 2. Knockdown of endogeneous CHC and replacement with GFP-tagged CHC constructs.
(A) Representative confocal images of cells expressing CHC constructs (left, green) that were immunostained for CHC (middle, red) using antibody X22. Nucleic acids are shown in blue in the merged panels (right). Scale bar, 10 μm. Note the knockdown of endogenous CHC in GFP and 1-479 and the X22 immunoreactivity in 1-1675.
(B) Histogram to compare the amount of X22 immunoreactivity in cells expressing each of the CHC constructs. Cells were outlined using the GFP channel as a guide and the mean greyscale pixel value for the red signal (X22/Alexa546) was measured. Results are mean ± s.e.m., from 26-47 cells per construct and are normalized to Control.

