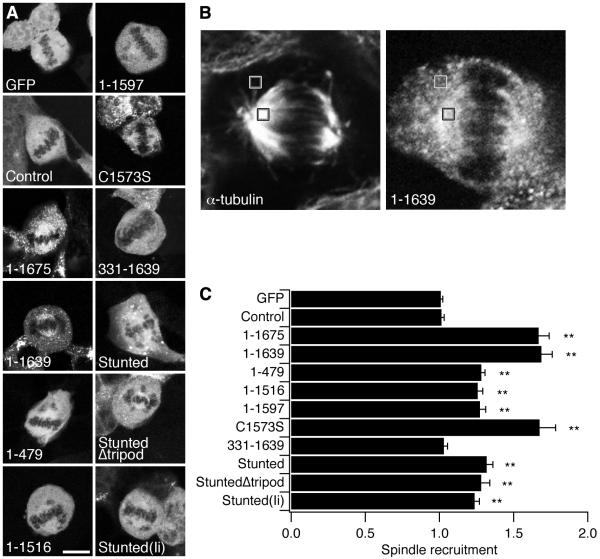
Figure 5. Constructs containing the N-terminal domain were recruited to the mitotic spindle.
(A) Representative confocal micrographs of each construct in HEK293 cells in metaphase. Scale bar, 10 μm.
(B) A cell expressing 1-1639 on a knockdown background. ROIs (grey, 1.04 × 1.04 μm) were placed over the spindle (black outline) and in the cytoplasm (white outline). Spindle regions and non-spindle areas were defined by staining for α-tubulin using DM1A/Alexa546 (left). Measurements were taken from the GFP channel (right).
(C) Histogram to show the recruitment to the spindle of CHC constructs on a CHC knockdown background. Spindle recruitment is the GFP fluorescence measured in a 1.04 × 1.04 μm ROI at the spindle divided by that measured in a same-sized ROI in the cytoplasm (Fspindle/Fcytoplasm). Results are mean ± s.e.m., from 12-27 cells per construct, **, p < 0.01.

