
Figure 2.
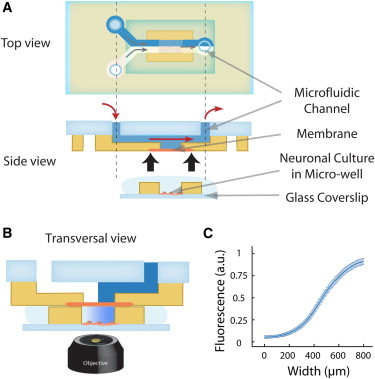
(A) Top and side schematic view of the Y-shaped microfluidic device used in the study. A fluidic microcircuit is interfaced via a porous membrane with cells cultured in a microwell. (B) Schematic sectional view of the assembled device for imaging assays. The coflow in the microcircuit generates a shear-free gradient in the microwell. (C) The concentration profile at the coverslip surface, measured by confocal microscopy and obtained by averaging profiles measured every 30 s over 1 h. The error bars indicate the standard deviation of the local concentration. The fluctuations of the relative gradient in the central part of the device are inferior to 5%.