
Figure 4.
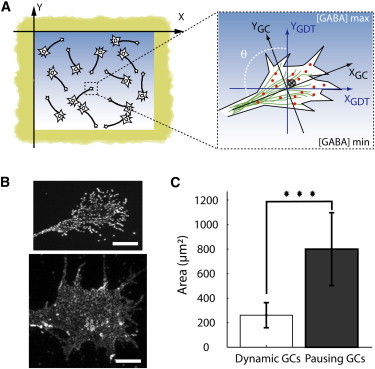
(A) Dissociated neurons plated in the microwell are stimulated with a GABA gradient. The positions of labeled GABAA receptors (dots) and their center of mass (cross) are recorded over time. (B) Maximum projection of fluorescence images of QD-labeled receptors diffusing in the membrane during the experiment and showing the shape of a thin and a large GC. Scale bar 10 μm. (C) Area of the analyzed growth cones. The differences between the two populations of neurons—pausing and dynamic growth cones—are statistically significant (p < 10−5, Kolmogorov-Smirnov test).