
Figure 5.
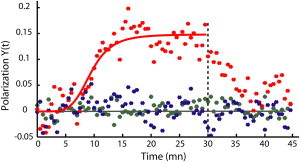
Mean position Y(t) of the labeled receptors along the YGC axis for dynamic GCs (red, 54 cells), pausing GCs (blue, 40 cells), and control conditions without GABA (green, 28 cells). After 30 min (dotted line), the gradient was switched off. The red line is an adjustment of the polarization Y(t) with the phenomenological curve Atn/(tn + Tn) (A = 0.15 ± 0.02, T = 9.2 ± 1.1 min, n taken equal to 5)(14).