
Figure 7.
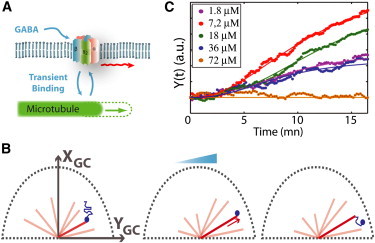
(A) Model is based on the coupling between the receptor diffusive movement in the membrane and MT dynamics (see (14) for details). (B) In a gradient, the coupled dynamics of the receptors (blue) and the MTs (red) acts as positive feedback leading to polarization at the GC membrane. (C) Simulated polarization Y(t) as a function of time for different mean concentration c (δ = 7.5 ± 0.4 10−3μm−1). The plain lines are adjustments with the curve Atn/(tn + Tn) (n taken equal to 5).