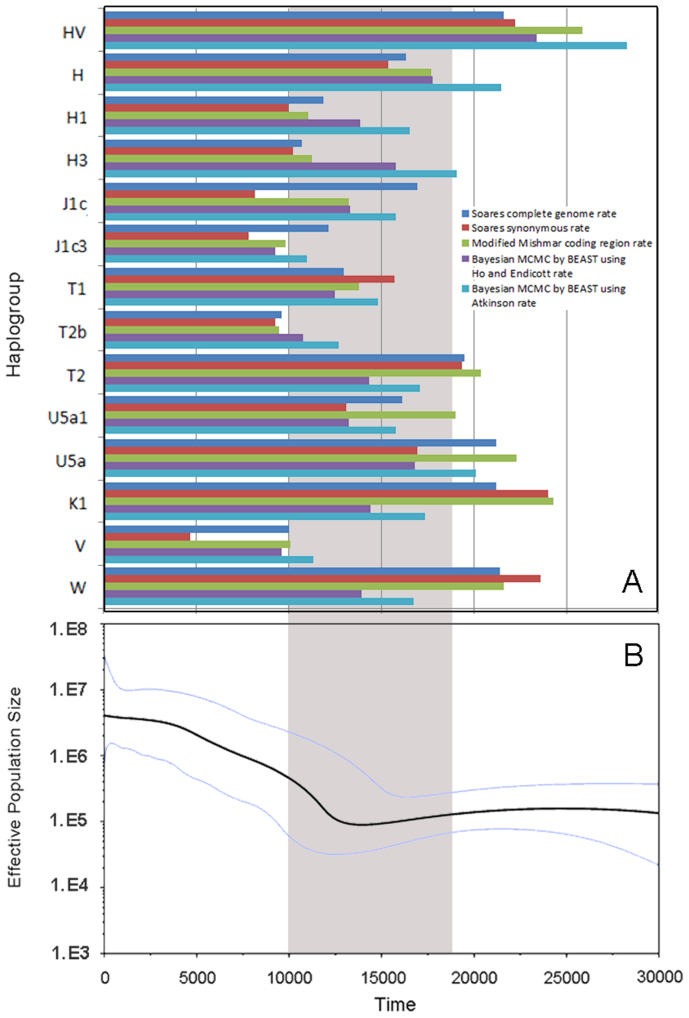
Figure 5. Time estimation of each observed expansion in 5 European populations and Bayesian skyline plot for 5 European populations together.
(A)Time estimation of each observed expansion in 5 European populations.(B) mtDNA Bayesian skyline plot showing size trend of the 5 European populations together, detailed setting refers to Methods. The grey area shows the time after LGM and before Neolithic Time.

