
Figure 6.
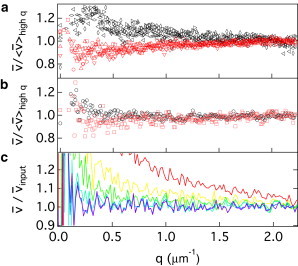
Swimming speed versus q from DDM. (a) Effect of tumbling (experiments): four data sets from the SW (black, top) and four data sets from the WT (red, bottom). (b) Effect of tumbling (simulations): SW (○) and WT . (c) Effect of depth of field δ for straight swimmers (simulations): 5, 10, 20, 40, 75 and 100 from top to bottom. To enable comparison and highlight the difference in q dependence, the swimming speed has been normalized to (a and b) or (c) the input mean swimming speed, , used to generate the simulated data.