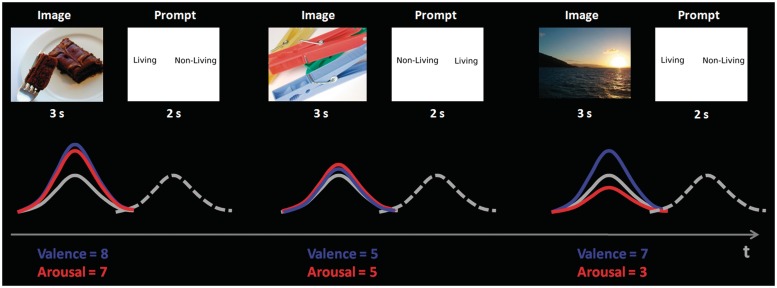
Fig. 1.
Illustration showing a schema of the fMRI analysis and parametric modelling of the haemodynamic response function. Each trial consisted of an image presented for 3000 ms, a pseudo-random jitter of 1000–3000 ms before the onset of the prompt for 2000 ms, followed by an inter-trial interval of between 5000 ms and 8000 ms. The valence and arousal ratings were included in the GLM as amplitude modulators and are shown in blue and red, respectively, whereas the constant or average BOLD response is represented by the solid grey response. The BOLD response to the prompts is shown as a dashed grey line.

