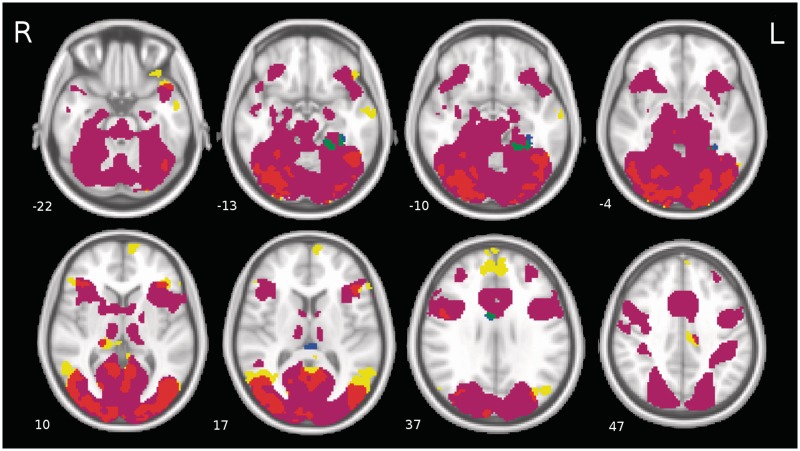
Fig. 2.
The group level results independent of the personality traits. A conjunction map was created to show the brain regions with a statistically significant constant BOLD signal not modulated by the emotional content of images, and brain regions where the BOLD signal was modulated by the arousal and valence characteristics of the stimuli. The colours represent the following: Purple = Constant BOLD response; yellow = regions modulated by arousal; red = regions activated in both the constant response and the arousal-dependent response; blue = regions modulated by valence; green = regions activated in both the constant response and the valence-dependent response. The numbers of the slices indicate the direction along the inferior–superior axis in millimetres in standard MNI space (−LPI).

