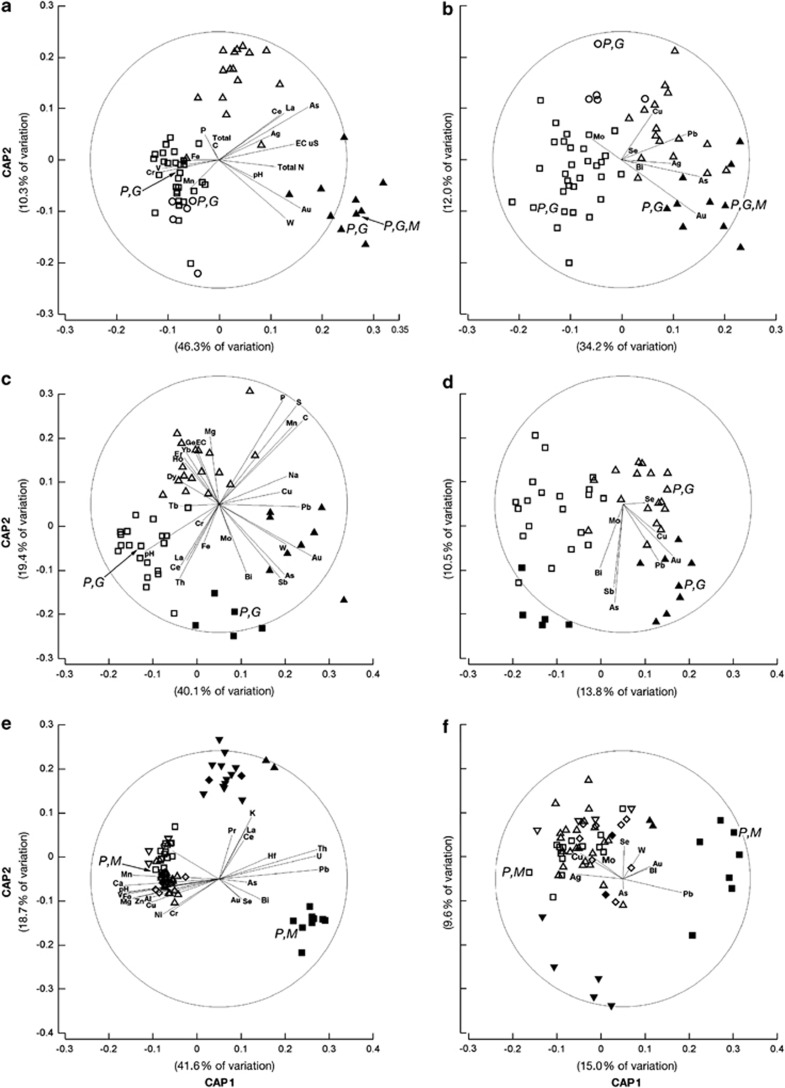
Figure 2.
Ordination plots of the first two CAs produced by CAP comparing geochemical (a, c and e) and geomicrobial data (b, d and f) of 62 Old Pirate-, 50 Tomakin Park, 75 Humpback and Wildcat sample sites from different geogenic settings. Old Pirate, a and b: (▴) auriferous, erosional; (Δ) non-auriferous, erosional; (□) non-auriferous, collovial; (○) non-auriferous alluvial; Tomakin Park c and d: (▴) auriferous, Ah-horizon; (Δ) non-auriferous, Ah-horizon; (▪) auriferous, B-horizon (□) non-auriferous, B-horizon; Humpback and Wildcat, e and f: (▪) granitic, erosional (▴) granitic, colluvial; (▾) granitic, depositional;(♦) granitic, alluvial; (□) mafic, erosional; (Δ) mafic, colluvial; (□) mafic, depositional; and (⋄) mafic, alluvial. Vectors of Spearman's correlations of the selected elements species with CAs are overlain; samples marked with M, P and G were used for microcosm experiments, PhyloChip and GeoChip analyses, respectively.

