
Figure 1.
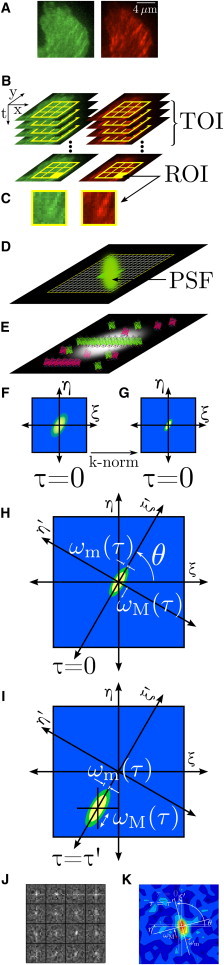
STICCS overview. (A) Fluorescence microscopy images in two channels, red and green, of a cell edge with visible adhesions, which are part of an image time series (B). The time subset of interest (TOI) is the subset of frames analyzed and the ROIs (shown as yellow squares in panels B–D) are the analyzed subregions. (D) The emission point spread function (PSF) represents the general focal volume and is oversampled by the pixels in the imaging charge-coupled device camera to have spatial correlations between adjacent pixels. The pixilated image maps fluorescence intensities integrated from a distribution of fluorophores with a spatial resolution set by the PSF; however, macroscopic fluorescent objects will be larger than the PSF, such as a focal adhesion made up of many fluorescent proteins (E in profile (26–29)). (F and G) General schematics of the spatio-temporal correlation functions (CF: raa, rbb, rab, or rba) at one ROI before and after k-space normalization, which effectively removes the PSF. Bivariate Gaussian functions are fit for each time lag (H and I), with the axes rotated by an angle θ to align with the major axis of the evolving CF (if present), yielding time-dependent radii of the major (ωM(τ)) and minor (ωM(τ)) axes. The CFs are fit for all ROIs (J) and all time lags. (K) Shows one time lag of a typical CF for a 16 × 16 pixel ROI from a cell. Velocity vectors are obtained by fitting the translating CF peaks (I) that are above defined thresholds.