
Figure 6.
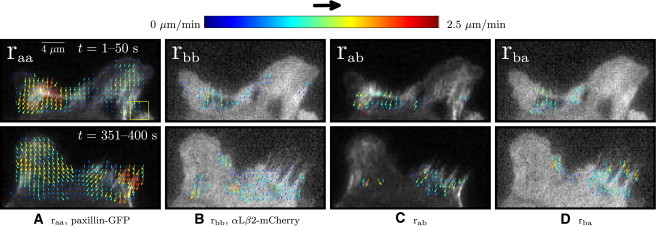
(A and B) ACF- and (C and D) CCF-calculated velocity maps of paxillin-GFP and αLβ2-integrin-mCherry (superimposed on the first image from the TOI). The analyses were performed at two different TOIs, each over Nf = 10 and δt = 5 s. (Top row) Frames 1–10 (t = 1–50 s). (Bottom row) Frames 71–80 (t = 351–400 s). Cross-correlation maps in panels C and D show transient interactions occurring at different times in regions where the adhesions become active. px,y = 0.21 μm and 16 × 16 pixels (3.4 × 3.4 μm) ROI (yellow square). Representative of two adhesions measured in four cells.