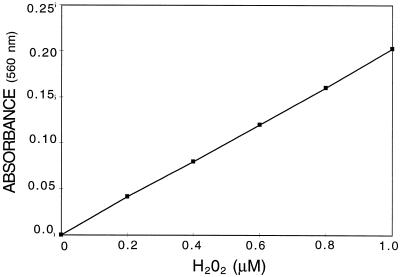
Figure 1.
Standard curve of the H2O2 concentration determined by the xylenol method in the range of 0.1 to 1 μm. H2O2 was measured with 100 μm xylenol orange, 250 μm Fe2+, and 100 μm sorbitol in 25 mm H2SO4. A560 was read after 45 min at room temperature. Data are the means of triplicate determinations. sd did not exceed ±3%.

