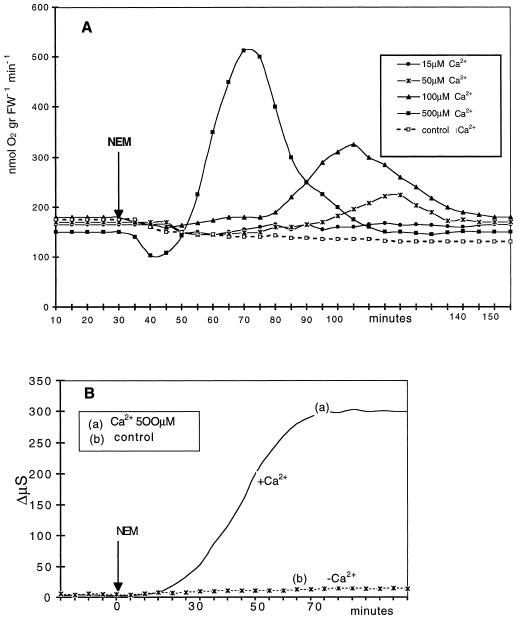
Figure 3.
Effects of increasing concentrations of Ca2+ on 0.2 mm NEM-induced respiratory burst (A) and Ca2+ dependence of NEM-induced electrolyte leakage (B). Experimental conditions were as in Figure 2. ΔQO2 data (A) are from one representative experiment out of three for each Ca2+ concentration tested. Conductivity change data (B) are the means of three experiments. se did not exceed ±8%. gr FW-1, Per gram fresh weight.

