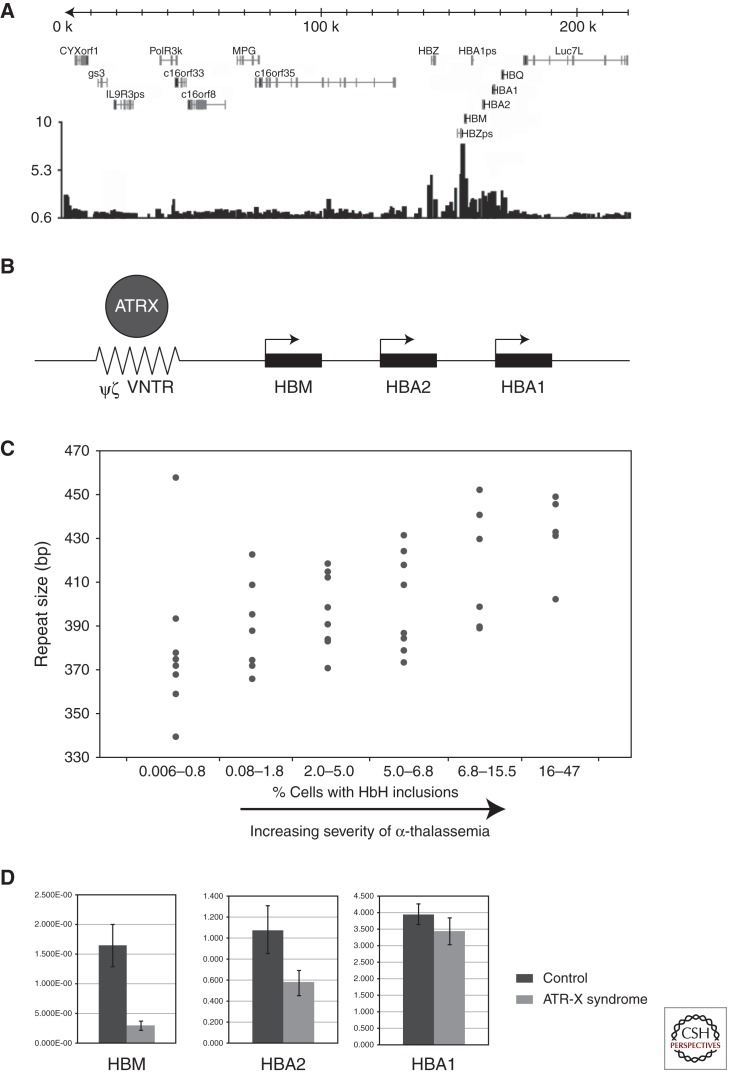
Figure 5.
(A) Microarray analysis of ATRX ChIP DNA enrichment from human erythroblasts across the 220-kb terminal region of chromosome 16p containing the α-globin genes (HBM, HBA2, HBA1, HBQ). (B) A schematic showing the relationship of the ψζ VNTR (peak of ATRX binding) to the adjacent α-globin genes. (C) ψζ VNTR length was measured in ATR-X patients with α-Thalassemia and the average length of the two alleles was plotted against the degree of α-Thalassemia as measured by percent red cells showing HbH inclusions (From Law et al. 2010; adapted, with permission, from the author). (D) Comparison of α-globin gene expression between a cohort of normal controls (n = 15) and individuals with ATR-X syndrome (n = 25) showing that the degree of down-regulation is related to the distance from the ψζ VNTR.

