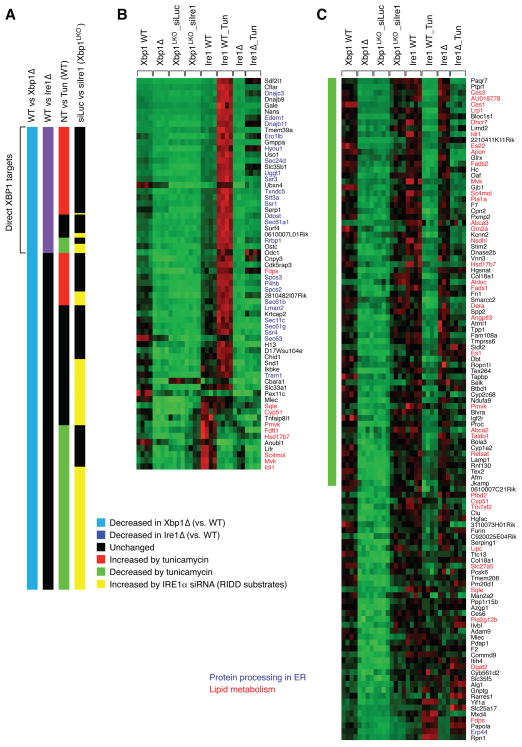
Figure 3.
Identification of direct XBP1 targets and RIDD substrates by microarray analysis. (A) Comparison of gene expression profiles between WT and Xbp1Δ; WT and Ire1Δ; untreated (NT) and tunicamycin-treated; siLuc and siIre1 injection to Xbp1LKO. Shown are data for 237 genes that were decreased in Xbp1Δ liver. (B) mRNA levels of 64 genes that were suppressed in both Xbp1Δ and Ire1Δ liver in individual liver samples. (C) mRNA levels of 112 genes that were induced by IRE1α siRNA in Xbp1LKO liver. Genes involved in protein folding processes in the ER are shown in blue. Lipid metabolism genes are highlighted in red.

