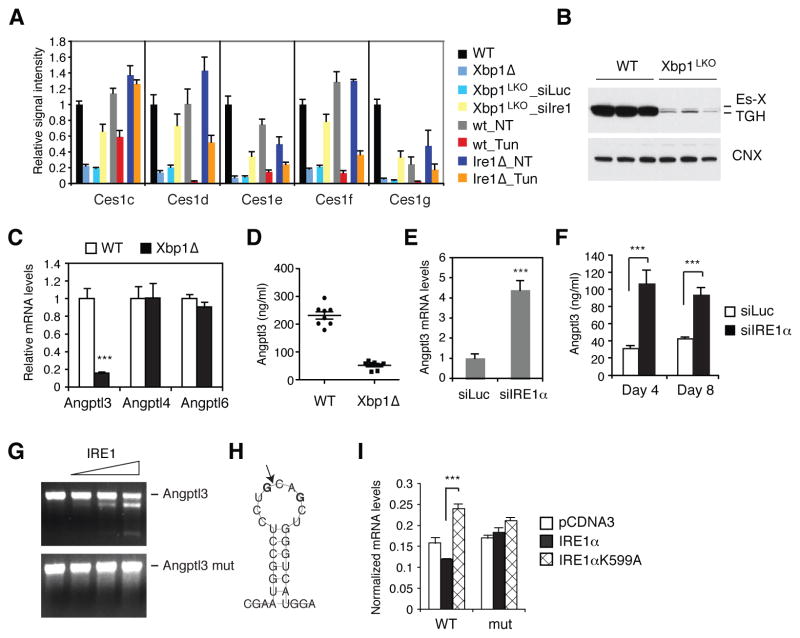
Figure 4.
Identification of Ces1 and Angptl3 mRNAs as RIDD substrates. (A) Microarray signals for Ces1 genes. (B) Western blot analysis of liver lysates of WT and Xbp1LKO mice using TGH (Ces1d) antibody which also detects Es-X (Ces1g). (C) Angptl3, -4, and -6 mRNA levels were measured in the liver of WT and XBP1 deleted male mice. n = 4 per group. (D) Plasma Angptl3 protein levels in WT and Xbp1Δ mice measured by ELISA. (E) Hepatic Angptl3 mRNA levels measured 8 days after siRNA injection of Xbp1LKO mice. n = 3–5 per group. (F) Plasma Angptl3 protein levels measured 4 or 8 days after siRNA injection to Xbp1LKO mice. n = 3–5 per group. (G) In vitro transcribed Angptl3 mRNA was incubated with recombinant IRE1α and then resolved on an agarose gel. Angptl3mut was generated by changing the two G residues to C shown in bold face in (H). (H) Predicted secondary structure of Angptl3 mRNA with a potential IRE1α cleavage site that is depicted by an arrow. (I) WT and mutant Angptl3 constructs were transfected into 293T cells together with WT or mutant IRE1α constructs. EGFP plasmid was also included in the transfection cocktail and served as a normalization control. Angptl3 mRNA levels in the transfected cells were measured by qRT-PCR. Values represent mean ± SEM. ***P <0.001.

