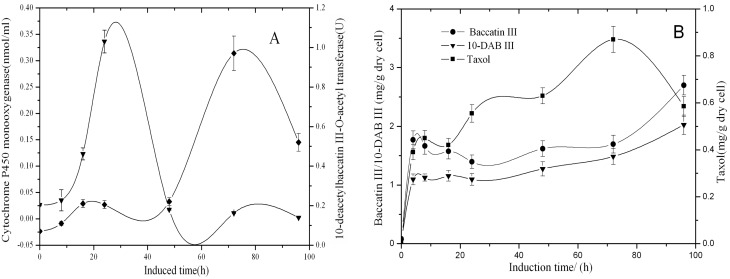
Figure 2. Time course of enzyme activity of 10-DBAT (♦), the concentration of cytochrome P450 monooxygenase (▾), the contents of 10-DAB III (▾), baccatin III (•) and taxol (▪) after the induction with 40 μl/l hydrogen peroxide (30%, w/w) in T. cuspidata cell suspension culture.
Samples were taken 0, 8, 16, 24, 48, 72 and 96 h after the induction. Values are means of triplicate results, and error bars represent the S.D.

